Il compito di un NMS, si sa, è quello di monitorare le prestazioni e lo stato di salute di server, router, switch, firewall e chi più ne ha più ne metta. Nel caso in cui gli oggetti da tenere sotto osservazione siano relativamente pochi (qualche centinatio) ed il server su cui è ospitato Nagios sia abbastanza corazzato (almeno 4/8 GB di RAM), il nostro NMS dovrebbe riuscire a svolgere il suo compito senza grosse difficoltà. Tutto si complica, ovviamente, se il numero degli oggetti da monitorare risulta piuttosto elevato (parliamo qualche migliaio). In tal caso è conveniente tenere sotto controllo le performance del nostro sistema di monitoring (e non solo quelle del server su cui è in esecuzione), poichè potrebbero essere presenti alcuni colli di bottiglia che ne inficiano il corretto funzionamento.
Esistono numerosi plugin sviluppati appositamente per Nagios ed in grado di restituirci dei feedback relativi allo stato di salute dell’NMS in questione, ma, per ovvie ragioni, ho deciso di demandare tale compito ad un tool esterno (leggasi Nagios indipendente): MRTG.
![]()
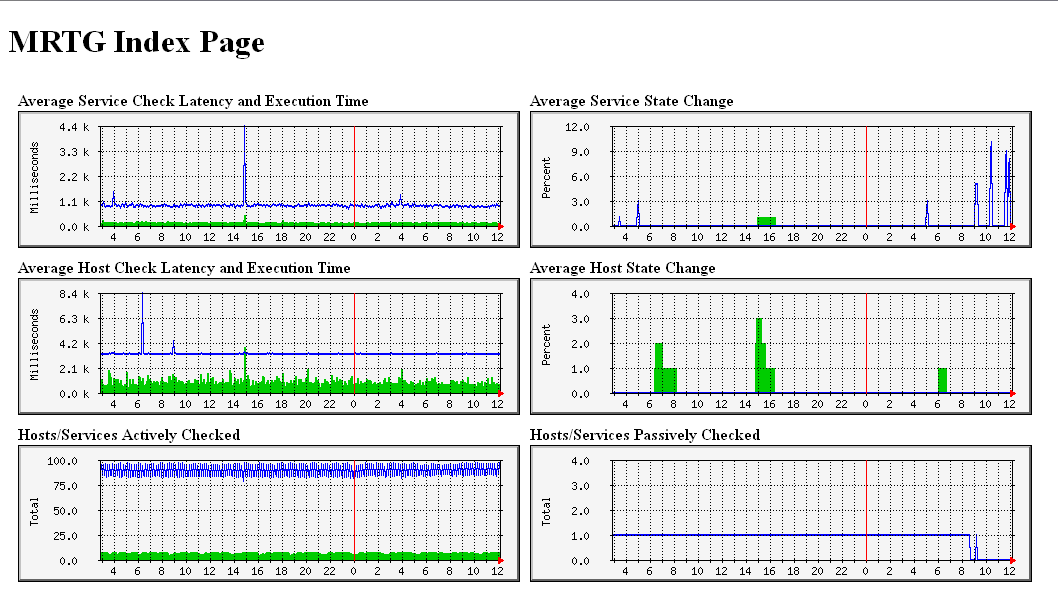
In questo post abbiamo visto come installarlo e come creare una configurazione valida per la misurazione della banda associata alle interfacce del nostro router. Adesso vedremo come integrarlo a Nagios in modo da ottenere (e graficizzare) le sue performance.
Di seguito riporto il contenuto del file nagios.cfg (presente all’interno della directory /etc/mrtg/), usato da MRTG per svolgere il proprio compito di monitoraggio:
WorkDir: /var/www/mrtg/nagios # Service Latency and Execution Time Target[nagios-a]: `/usr/bin/nagiostats --mrtg --data=AVGACTSVCLAT,AVGACTSVCEXT,PROGRUNTIME,NAGIOSVERPID` MaxBytes[nagios-a]: 100000 Title[nagios-a]: Average Service Check Latency and Execution Time PageTop[nagios-a]: <H1>Average Service Check Latency and Execution Time</H1> Options[nagios-a]: growright,gauge,nopercent YLegend[nagios-a]: Milliseconds ShortLegend[nagios-a]: LegendI[nagios-a]: Latency: LegendO[nagios-a]: Execution Time: Legend1[nagios-a]: Latency Legend2[nagios-a]: Execution Time Legend3[nagios-a]: Maximal 5 Minute Latency Legend4[nagios-a]: Maximal 5 Minute Execution Time # Service Percent State Change Target[nagios-b]: `/usr/bin/nagiostats --mrtg --data=AVGACTSVCPSC,AVGPSVSVCPSC,PROGRUNTIME,NAGIOSVERPID` MaxBytes[nagios-b]: 100 Title[nagios-b]: Average Service State Change PageTop[nagios-b]: <H1>Average Service State Change</H1> Options[nagios-b]: growright,gauge,nopercent YLegend[nagios-b]: Percent ShortLegend[nagios-b]: LegendI[nagios-b]: Active Check % Change: LegendO[nagios-b]: Passive Check % Change: Legend1[nagios-b]: State Change Legend2[nagios-b]: State Change Legend3[nagios-b]: Maximal 5 Minute State Change Legend4[nagios-b]: Maximal 5 Minute State Change # Host Latency and Execution Time Target[nagios-c]: `/usr/bin/nagiostats --mrtg --data=AVGACTHSTLAT,AVGACTHSTEXT,PROGRUNTIME,NAGIOSVERPID` MaxBytes[nagios-c]: 100000 Title[nagios-c]: Average Host Check Latency and Execution Time PageTop[nagios-c]: <H1>Average Host Check Latency and Execution Time</H1> Options[nagios-c]: growright,gauge,nopercent YLegend[nagios-c]: Milliseconds ShortLegend[nagios-c]: LegendI[nagios-c]: Latency: LegendO[nagios-c]: Execution Time: Legend1[nagios-c]: Latency Legend2[nagios-c]: Execution Time Legend3[nagios-c]: Maximal 5 Minute Latency Legend4[nagios-c]: Maximal 5 Minute Execution Time # Host Percent State Change Target[nagios-d]: `/usr/bin/nagiostats --mrtg --data=AVGACTHSTPSC,AVGPSVHSTPSC,PROGRUNTIME,NAGIOSVERPID` MaxBytes[nagios-d]: 100 Title[nagios-d]: Average Host State Change PageTop[nagios-d]: <H1>Average Host State Change</H1> Options[nagios-d]: growright,gauge,nopercent YLegend[nagios-d]: Percent ShortLegend[nagios-d]: LegendI[nagios-d]: Active Check % Change: LegendO[nagios-d]: Passive Check % Change: Legend1[nagios-d]: State Change Legend2[nagios-d]: State Change Legend3[nagios-d]: Maximal 5 Minute State Change Legend4[nagios-d]: Maximal 5 Minute State Change # Hosts/Services Actively Checked Target[nagios-e]: `/usr/bin/nagiostats --mrtg --data=NUMHSTACTCHK5M,NUMSVCACTCHK5M,PROGRUNTIME,NAGIOSVERPID` MaxBytes[nagios-e]: 7000 Title[nagios-e]: Hosts/Services Actively Checked PageTop[nagios-e]: <H1>Hosts/Services Actively Checked</H1> Options[nagios-e]: growright,gauge,nopercent YLegend[nagios-e]: Total ShortLegend[nagios-e]: LegendI[nagios-e]: Hosts: LegendO[nagios-e]: Services: # Hosts/Services Passively Checked Target[nagios-f]: `/usr/bin/nagiostats --mrtg --data=NUMHSTPSVCHK5M,NUMSVCPSVCHK5M,PROGRUNTIME,NAGIOSVERPID` MaxBytes[nagios-f]: 7000 Title[nagios-f]: Hosts/Services Passively Checked PageTop[nagios-f]: <H1>Hosts/Services Passively Checked</H1> Options[nagios-f]: growright,gauge,nopercent YLegend[nagios-f]: Total ShortLegend[nagios-f]: LegendI[nagios-f]: Hosts: LegendO[nagios-f]: Services: # Used/Avail External Command Buffers Target[nagios-g]: `/usr/bin/nagiostats --mrtg --data=TOTCMDBUF,USEDCMDBUF,PROGRUNTIME,NAGIOSVERPID` MaxBytes[nagios-g]: 7000 Title[nagios-g]: External Command Buffers PageTop[nagios-g]: <H1>External Command Buffers</H1> Options[nagios-g]: growright,gauge,nopercent YLegend[nagios-g]: Buffers ShortLegend[nagios-g]: LegendI[nagios-g]: Total: LegendO[nagios-g]: Used: # Active Host Checks Target[nagios-i]: `/usr/bin/nagiostats --mrtg --data=NUMSACTHSTCHECKS5M,NUMOACTHSTCHECKS5M,PROGRUNTIME,NAGIOSVERPID` MaxBytes[nagios-i]: 7000 Title[nagios-i]: Active Host Checks PageTop[nagios-i]: <H1>Active Host Checks</H1> Options[nagios-i]: growright,gauge,nopercent YLegend[nagios-i]: Checks ShortLegend[nagios-i]: LegendI[nagios-i]: Scheduled Checks: LegendO[nagios-i]: On-Demand Checks: # Active Service Checks Target[nagios-j]: `/usr/bin/nagiostats --mrtg --data=NUMSACTSVCCHECKS5M,NUMOACTSVCCHECKS5M,PROGRUNTIME,NAGIOSVERPID` MaxBytes[nagios-j]: 7000 Title[nagios-j]: Active Service Checks PageTop[nagios-j]: <H1>Active Service Checks</H1> Options[nagios-j]: growright,gauge,nopercent YLegend[nagios-j]: Checks ShortLegend[nagios-j]: LegendI[nagios-j]: Scheduled Checks: LegendO[nagios-j]: On-Demand Checks: # Passive Host/Service Checks Target[nagios-k]: `/usr/bin/nagiostats --mrtg --data=NUMPSVHSTCHECKS5M,NUMPSVSVCCHECKS5M,PROGRUNTIME,NAGIOSVERPID` MaxBytes[nagios-k]: 7000 Title[nagios-k]: Passive Host/Service Checks PageTop[nagios-k]: <H1>Passive Host/Service Checks</H1> Options[nagios-k]: growright,gauge,nopercent YLegend[nagios-k]: Checks ShortLegend[nagios-k]: LegendI[nagios-k]: Host Checks: LegendO[nagios-k]: Service Checks: # Cached Host/Service Checks Target[nagios-l]: `/usr/bin/nagiostats --mrtg --data=NUMCACHEDHSTCHECKS5M,NUMCACHEDSVCCHECKS5M,PROGRUNTIME,NAGIOSVERPID` MaxBytes[nagios-l]: 7000 Title[nagios-l]: Cached Host/Service Checks PageTop[nagios-l]: <H1>Cached Host/Service Checks</H1> Options[nagios-l]: growright,gauge,nopercent YLegend[nagios-l]: Checks ShortLegend[nagios-l]: LegendI[nagios-l]: Host Checks: LegendO[nagios-l]: Service Checks: # External Commands Target[nagios-m]: `/usr/bin/nagiostats --mrtg --data=NUMEXTCMDS5M,0,PROGRUNTIME,NAGIOSVERPID` MaxBytes[nagios-m]: 7000 Title[nagios-m]: External Commands PageTop[nagios-m]: <H1>External Commands</H1> Options[nagios-m]: growright,gauge,nopercent YLegend[nagios-m]: Commands ShortLegend[nagios-m]: LegendI[nagios-m]: Commands: LegendO[nagios-m]: # Parallel/Service Host Checks Target[nagios-n]: `/usr/bin/nagiostats --mrtg --data=NUMPARHSTCHECKS5M,NUMSERHSTCHECKS5M,PROGRUNTIME,NAGIOSVERPID` MaxBytes[nagios-n]: 7000 Title[nagios-n]: Parallel/Serial Host Checks PageTop[nagios-n]: <H1>Parallel/Serial Host Checks</H1> Options[nagios-n]: growright,gauge,nopercent YLegend[nagios-n]: Checks ShortLegend[nagios-n]: LegendI[nagios-n]: Parallel Checks: LegendO[nagios-n]: Serial Checks:
Il giro del fumo può banalmente essere riassunto in questo modo: viene lanciato l’applicativo nagiostats, al quale vengono affiancate alcune flag come –mrtg e –data (quest’ultima serve a specificare i parametri da monitorare, ad esempio NUMPSVHSTCHECKS5M,NUMPSVSVCCHECKS5M,PROGRUNTIME,NAGIOSVERPID).
Occorre precisare, inoltre, che nagiostats viene eseguito direttamente dal crontab che richiama MRTG, ragion per cui è indispensabile configurare SElinux in modo da consentire tale operazione.
Creiamo la directory che ospiterà la pagina Web contenente le i grafici associati alle prestazioni di Nagios:
[root@linuxbox ~]# mkdir -p /var/www/mrtg/nagios
e successivamente passiamo alla creazione della pagina index.html:
[root@linuxbox ~]# indexmaker --output=/var/www/mrtg/nagios/index.html /etc/mrtg/nagios.cfg
Infine, modifichiamo il contenuto del file /etc/cron.d/mrtg, aggiungendo la stringa:
*/5 * * * * root LANG=C LC_ALL=C /usr/bin/mrtg /etc/mrtg/nagios.cfg --lock-file /var/lock/mrtg/nagios_l --confcache-file /var/lib/mrtg/nagios.ok
Come ultimo step creiamo la configurazione di Apache per l’accesso alla pagina Web in cui sono presenti i grafici generati da MRTG:
[root@linuxbox ~]# nano /etc/httpd/conf.d/mrtg.conf
Il cui contenuto dovrà essere simile al seguente:
Alias /mrtg /var/www/mrtg

<Location /mrtg>
    Order deny,allow
    Allow from all
    AuthName "MRTG Access"
    AuthType Basic
    AuthUserFile /etc/mrtg/passwd
    Require valid-user
</Location>
Infine, creiamo il file contenente user e pass per l’accesso alla suddetta pagina Web:
[root@linuxbox ~]# htpasswd -c /etc/mrtg/passwd <vostrouser>
Ricarichiamo la configurazione di Apache:
[root@linuxbox ~]# service apache reload
ed abbiamo finito:
Alla prossima.